Prometheus monitoring precision issues

Environment
Measuring API requests using Prometheus monitoring and outputing the results to Grafana dashboards.
Plenty of documentation and info on prometheus site ...
What could be more simple? What may go wrong?
I am working on a team, developing APIs using python, built on FastAPI, monitoring implemented using starlette_exporter and python prometheus client, running on uvicorn, nothing fancy (not getting into the details on the rest of the stack services).
Nonetheless article is not specific for the technologies mentioned, I want to discuss revelations of using Prometheus monitoring and confusion related. Solutions discussed here are considered without using any third party tools or services.
Monitoring was implemented in API. Prometheus, metrics started to be collected, but from time to time they looked suspicious, until I decided to spent a reasonable amount of time for testing and investigation.
Metric
Within this article I am discussing a single metric, let's call it requests_total.
I want the chart to see the number of requests received at a specific time (initial idea: requests per minute), grouped by status code.
So I have used PromQL query, like:
sum by (status_code) (increase(requests_total{..some filters...}[1m]))
Assuming I want to have the possibility to check the amount of requests per different time intervals (1 minute, 5 minutes, 1 hour, etc..), I have built variable and called it Interval in Grafana with values: 1m, 5m, 15m, 1h).
Now the query looks like:
sum by (status_code) (increase(requests_total{..some filters...}[${Interval}]))
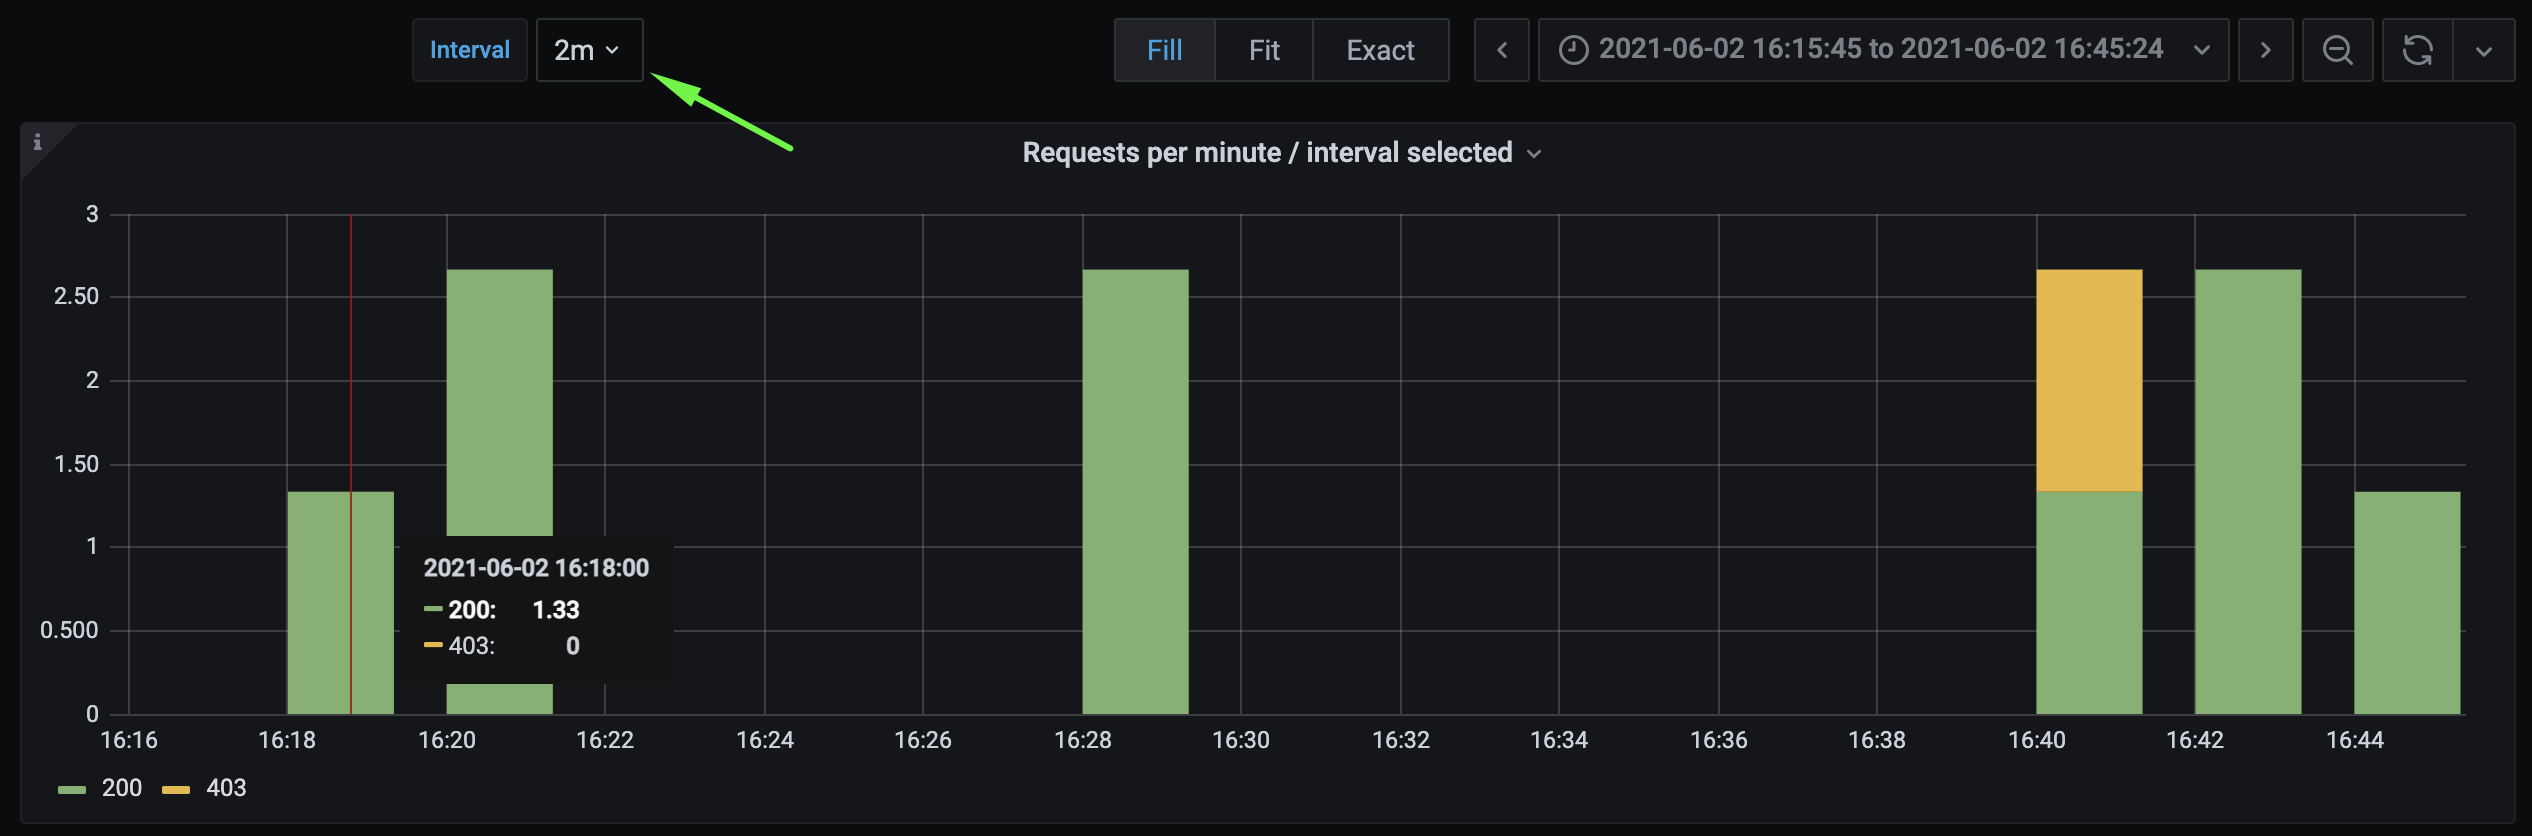
Also I have specified Min step in Grafana graph, equal to variable ${Interval} as a result I have a dynamic Grafana dashboard with request numbers:

- all screenshots have some sensitive, non-relevant filter cut out from screenshots
The Issue
After some data looked suspicious, I started testing the endpoint, by making different number of requests and comparing the data using different intervals (using cURL, Postman, etc.).
Results observed for same metric, same value, but different time intervals:


Multiple issues and inconsistencies were observed:
1) After making 10 requests, they were distributed over several bars instead of one I expected.
2) Bar value sometimes show 2x value of requests made:
- 2 instead of 1
- 4 instead of 2
3) Request number is not exact - after making 2 requests, a value of 2.33 is displayed.
The answer
The answer I have found out - this is normal behaviour for Prometheus.
Monitoring system is not designed for precise calculation, especially for low number / slowly increasing metrics within small periods of time, compared to configured scraping interval.
Solutions - one by one
1) Values distributed over several bars:
Since prometheus breaks the timeline into strict intervals, if some value change occurred within one interval, and rest of the increases appeared within the other - you get two bars, just specifying part of the change within each interval, it doesn't matter that these changes appeared within couple of seconds, but if they fall into different intervals - they will be provided as two different values:

Solution: no bulletproof solution found for slow moving or occasional burst systems - if value changes fall within different timeframes, this will be displayed accordingly.
It is possible to play with different time intervals, time offset, but still at some point the issue occurs.
2) Prometheus shows 2x value of actual change:
This is best explained in this SO post.
The bottom line:
- In my case I have prometheus scrape interval equal to 30s, this means that prometheus has data points with values every 30 s.
- If I set
increase()interval equal to 1m (increase(requests_total{..some filters...}[1m])), then almost always this will result in 2 points of scrape within 1 min timeframe as the first scrape almost never will not occur at the exact moment of 1m interval start.
The logic below is applied in resolving the value displayed in Grafana dashboard:- Average
rate()(change per second) within scrape intervals within the timeframe: change of1within30sresults in rate = 1/30 requests per second - Final
increase()value within the timeframe: average change within1m or 60sresults in increase = (1/30)*60 = 2! requests per minute
- Average
So this produces for value change of 1, result equal to 2:
Next point is related to the previous explanation.
3) Resulting value of increase is not the whole number:
This issue is caused due to reasons:
- increase() function is built on top of rate() function, which just calculates average change of value over specific time interval. So it is not just difference of value between several scrape points.
- scrape points, though they have specific interval configured (
30sfor example), will not occur exactly at specific time, due to failed scrapes, connection or load issues, so time may differ. Also if there are only few datapoints inside a time range, prometheus for the sake of "correctness" extrapolates the value.
Solution(s)
In my case the simplest solution for (2) and (3) clauses is to use interval at least 4x bigger than prometheus scrape interval (the bigger the ration, more values displayed are close to real numbers) and, well, don't expect very precise data for short intervals.
(example: 2min when having 30s scrape interval)
Alternative, additional solution could be to shorten prometheus scrape interval (to 15s or 10s), but in our case this is unified value across multiple systems, so change was not a viable option.
Sources and useful links
- https://prometheus.io/docs/prometheus/latest/querying/functions/#increase
- https://stackoverflow.com/questions/48218950/increase-in-prometheus-sometimes-doubles-values-how-to-avoid
- https://stackoverflow.com/questions/38665904/why-does-increase-return-a-value-of-1-33-in-prometheus
- https://www.youtube.com/watch?v=67Ulrq6DxwA&t=15m02s
I am fresh developer and this is my first article after several earlier attempts :) , so don't judge too harshly, any feedback on contents or style is welcome!